


 Documentation Home
 Recently Changed
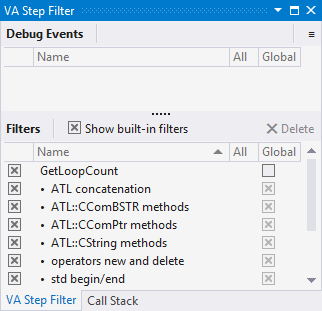
The VA Step Filter is a tool window of Visual Assist that let you automatically step over methods when using the native C/C++ debugger. When filtering, you can step into the body of a method without stepping into, and out of, methods in an argument list.
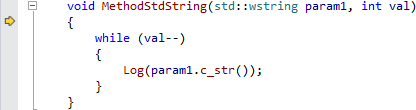
In the following example, the debugger normally must step into the methods that comprise the argument list of MethodStdString before it steps into the body of MethodStdString—the most likely location of a bug.
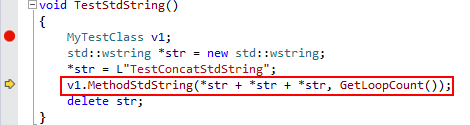
If you step into MethodStdString, the debugger steps first into GetLoopCount.
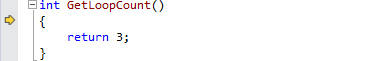
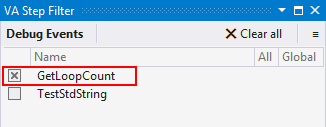
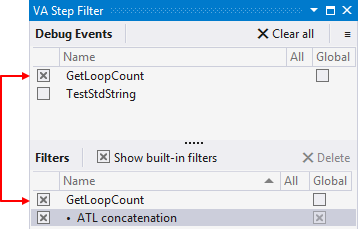
Since the method is simple and unlikely to be the culprit in any future investigation of a bug, you can instruct the VA Step Filter to make the debugger step over GetLoopCount the next time the method is encountered—in the current and future sessions of the debugger. Toggle the checkbox to enable automatic step over.
If you step out of GetLoopCount, and step back into MethodStdString—the original intent—the debugger must step into the standard string class in the example—to concatenate str, str, and str.
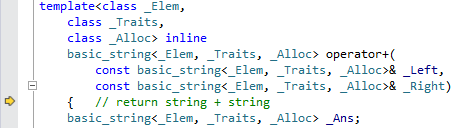
The VA Step Filter includes several built-in filters, one of which causes the debugger to step over concatenation in the standard string class.
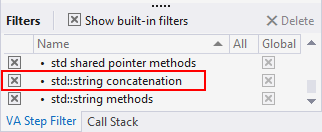
If the built-in filter for string concatenation had been enabled, the debugger would have stepped over the string class and moved directly from GetLoopCount to the body of MethodStdString.
With the creation of a solution-specific filter for GetLoopCount, and the enabling of the built-in filter for concatenation in the standard string class, the debugger will step directly into the body of MethodStdString the next time it encounters a similar invocation of MethodStdString.
Access
The VA Step Filter must be enabled before the start of a debug session if you intend to use the filter during the session. Once enabled, the VA Step Filter will run in all IDE and native C/C++ debugger sessions until disabled.
When the VA Step Filter is enabled, it will cause the debugger to step over methods whether or not the VA Step Filter is visible.
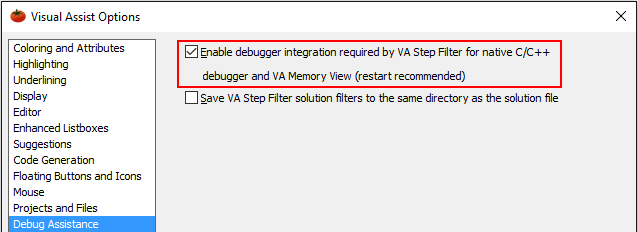
Enable the VA Step Filter in the options dialog of Visual Assist. Restart your IDE.
Disable the step filter only if you suspect it conflicts with another debugger service. You must restart your IDE if you want Visual Assist to disconnect completely from the debugger.
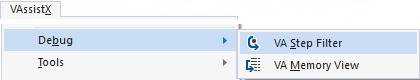
If the VA Step Filter is not visible when you start debugging, select it from the VAssistX entry in the menubar (Alt+X, B, S).
The VA Step Filter can float, hide, dock, or be tabbed with other tool windows.
Visual Studio 2008 and older
The VA Step Filter is not available.
Execution
The VA Step Filter does not change execution of a program under the control of the debugger. When the VA Step Filter is enabled, methods you step over are still executed and if your methods contain breakpoints, those breakpoints will be hit.
Layout
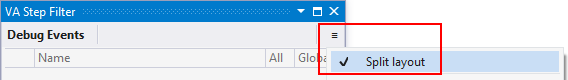
The VA Step Filter has two layouts: split and non-split. The split layout is used more often when building initial filters for a solution; the non-split layout is used more often when filters are well established and you want to work only from debug events.
You can toggle between the two layouts in the settings menu.
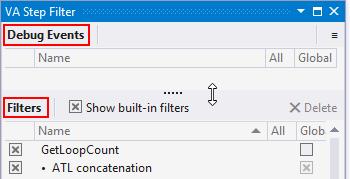
In split layout, debug events and filters are visible at the same time, and a horizontal splitter lets you divide space between the two panes.
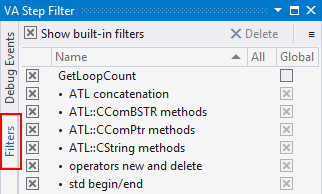
In non-split layout, left-justified tabs let you switch between debug events and filters.
Columns
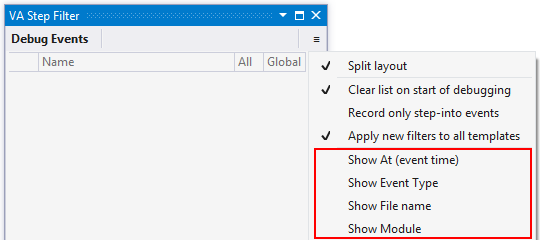
You can resize, collapse, and move columns in both panes of the VA Step Filter. In Debug Events, you also have the option to show/hide columns containing additional information about events:
- At (time of last debug event)
- Event Type (breakpoint, step into, step over, step out)
- File name (double-click to open file in editor)
- Module
Debug Events
The Debug Events pane is populated as you navigate the native C/C++ debugger. By default, debugger events include: breakpoint, step into, step out, and step over.
Events are sorted by time, so the newest event appears at the top of the pane. If a method or function in the list is invoked again, it moves to the top.
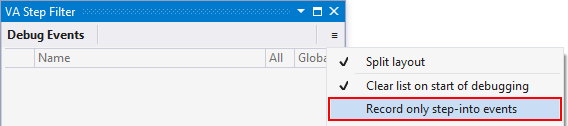
If you tend to set filters only after step-into events, you might eliminate the other types of events from the pane. (Recording only step-into events does not clear the pane. The setting affects only future events.)
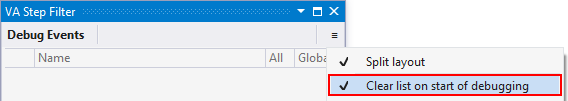
By default, the VA Step Filter clears the list of debug events every time the debugger starts. You can retain the list between sessions via the settings menu.
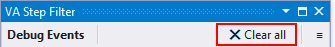
You can clear the list of events manually, done typically during debug sessions.
Clearing does not affect the state of filters removed from the Debug Events. The states of all filters are always retained in Filters.
Editing Filters
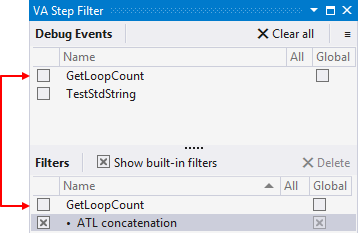
You can create a filter for any function or method that appears in Debug Events. When you create a filter, it remains in Debug Events because it occurred recently, yet it appears also in Filters. You enable/disable a filter using either checkbox associated with it—in Debug Events if the event occurred recently, or in Filters. (The checkboxes are connected.)
If you disable a filter, it is disabled temporarily. A disabled filter remains in Filters, where you can re-enable it in the current or a future debug session.
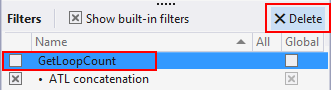
If you expect never to reuse a filter, select it and delete it from Filters. (You cannot delete a filter from Debug Events.)
You cannot rename filters.
Template Filters
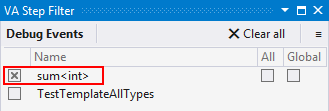
Instantiations of function templates and methods of template classes can appear in Debug Events. When they do, the function template or method appears with the particular type of the instantiation.
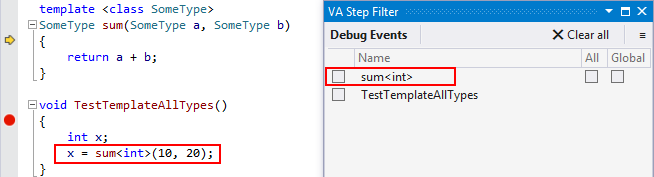
Use the checkbox for the entry to create a filter that causes the debugger to step over other instantiations of the function template or method with the same type.
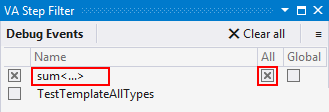
Check the "All" box associated with the filter using the mouse or keyboard 'a' if you want the filter to apply to all types in all instantiations. When enabled, the particular type in the filter is replaced with an ellipsis to imply "all types".
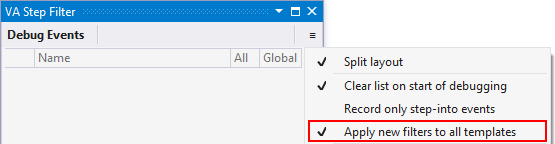
If you want templates filters to apply to all types by default, enable the option in the settings menu.
Scope of Filters
The filters you create, and their states, are solution-specific by default. Your filters appear each time you open and debug your solution. Your enabled filters will be enabled when you restart the debugger.
If you want a filter to apply to all solutions that you open with the current version of the IDE, make it a global filter. Check either of the Global checkboxes associated with the filter—in Debug Events if the event occurred recently, or in Filters. (The checkboxes are connected.)
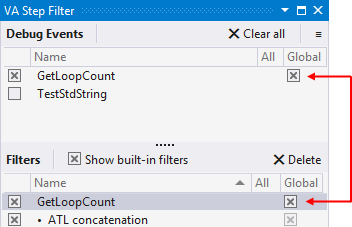
You can toggle the Global checkbox with the mouse or keyboard 'g'.
Built-In Filters
Visual Assist ships with several built-in filters that cause the native C/C++ debugger to step over commonly invoked methods that don't need to be debugged. For example, the "std::list begin/end" filter causes the debugger to step over the begin and end functions in a list container.
Built-in filters are identified by their leading dots and descriptive names. (The dots cause the built-in filters to sort as a group.)
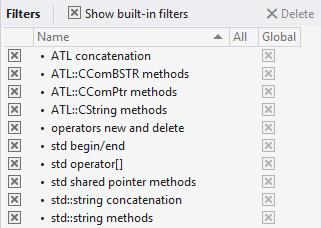
You can enable/disable built-in filters via their checkboxes.
Built-in filters always have global scope, meaning they apply to all solutions that you open with the IDE. The states of built-in filters are saved between sessions of the debugger and IDE.
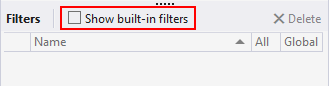
You can hide built-in filters, but hiding does not affect their states. When hidden, built-in filters can still cause the debugger to step over respective functions or methods. (You must show built-in filters to change their states.)
You can enable/disable individual built-in filters, but you cannot delete or rename them.
Location and Sharing of Saved Filters
By default, filters and their settings are saved to AppData\Roaming, where they might be accessible from multiple development PCs (in environments where profile roaming services are enabled). Specifically, the following items of the VA Step Filter are saved:
- solution-specific filters, i.e. filters for which "Global" is not checked, and their states
- global filters, i.e. those that apply to all solutions, their states, and states of built-in filters
If you wish to share solution-specific filters with a team, or you work from multiple PCs that do not support roaming profiles, you can save the solution-specific filters to $(SOLUTIONDIR)\.va\ via a setting in the options dialog of Visual Assist.

The VA Step Filter selects the location for solution-specific filters when a solution is opened, and writes to the location each time the filter list is changed. Hence, changing location when no solution is open means solution-specific filters are written to the location you expect.
If solution-specific filters exist before a change in location, copy/move the filters external to Visual Studio before changing the location in the options dialog of Visual Assist. The solution-specific filters are in AppData\Roaming\VisualAssist\DebuggerTools\SolutionConfigs\*.vadbg or $(SolutionDir)\.va\*.vadbg.
Solution filters are saved with file paths relative to the solution so filters can be used with branches of source code.