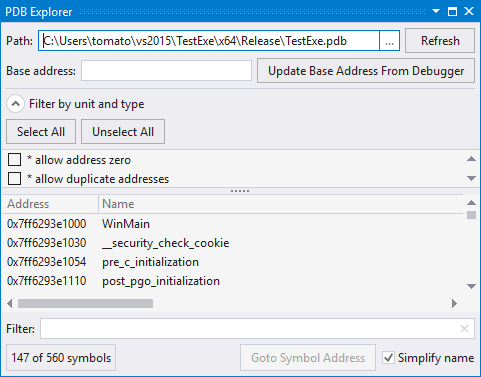
PDB Explorer is an advanced tool for debugging native code when source is not available. PDB Explorer lets one browse and search for symbols in modules that comprise executable code, whether or not the code is in a running process. If in a process, PDB Explorer can direct the Visual Studio debugger to jump to locations of symbols in virtual memory.
Analogous to Find Symbol in Solution, which lets one efficiently find symbols defined through a solution, PDB Explorer lets one efficiently find symbols in EXEs and DLLs.

PDB Explorer can be used with or without a PDB, and with or without a running process. PDB Explorer supports all PDBs from release builds. A PDB from a debug build that seems to have no symbols is unsupported.
Given only an EXE or DLL module, PDB Explorer lets one browse symbols exported and imported by the module. If a release PDB is also available, PDB Explorer lets one browse static symbols in the module. Use either mode, without a running process, to explore symbols and routines internal to a module.
PDB Explorer is also useful when its instance of Visual Studio is debugging a process running a module. During debug, PDB Explorer lets one efficiently browse symbols in a module, locations of functions in virtual memory, and locations of data. PDB Explorer can direct the debugger to jump to locations in the disassembly, where breakpoints can be set and values modified.
Access
Open PDB Explorer using VAssistX | Debug | PDB Explorer (Alt+X, B, E). Like all tool windows, PDB Explorer can float or be docked.

Loading a Module
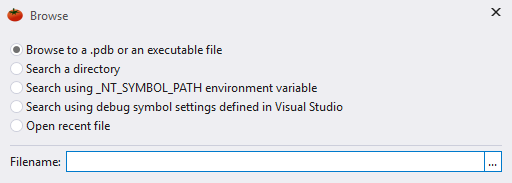
To explore the symbols in an EXE, DLL, or PDB, load a module using the [...] icon and the dialog that follows.

Only one module may be loaded at a time. Functionality of PDB Explorer varies with the type of module loaded. If you intend to explore the symbols of a running process, load a module that the running process has loaded. (Exploring a module not loaded by the running process limits PDB Explorer to functionality without a running process.)
Load a PDB directly if:
- you are certain you can identify the PDB with symbols of interest, especially if associated with a running process, and
- the PDB is moderate in size. (PDBs for large projects can take many minutes to load.)
Load an EXE or DLL module and let PDB Explorer find its PDB (by checking 'Use .pdb if found') if:
- you are not certain which PDB is the correct one for a running process, or
- the PDB on located on a symbol server
Load an EXE or DLL module and do not use its PDB if:
- you want to explore only symbols exported by the module, or
- the PDB is extremely large and waiting for its load is unnecessarily long. (In this case, browsing is limited to exported symbols.)
Refresh a module if its path was entered or edited manually, or if its PDB changed during a session of PDB Explorer.
Symbol Servers
Symbol servers host PDBs for multiple builds of an application. For a loaded module with "use .pdb if found" checked, PDB Explorer locates its PDB using settings in the instance of Visual Studio that is running PDB Explorer. Settings are obtained from:
Visual Studio | Tools | Options | Debugging | Symbols
The correct PDB for the build of the loaded module will be automatically selected using a signature in the loaded module.
Base Address
The base address of a loaded module is not necessary to browse the symbols in the loaded module. A base address is required, on the other hand, before PDB Explorer can instruct the debugger of Visual Studio to jump to locations in the virtual memory of a running process. A base address is also required to browse symbols nearby one whose address in virtual memory was obtained from Address Resolver.
If a running process is under control of the debugger in Visual Studio, press "Update Base Address From Debugger" to set the base address. As long at the running process does not move the module, e.g. reload it, the value will remain current. Update the base address any time you suspect it has changed.

Filtering
Several built-in filters constrain the set of symbols available for exploring. For large modules, the filters greatly simplify the hunt for unknown or like-named symbols. The available built-in filters vary with the set of all symbols.

The built-in filter "allow address zero" constrains or shows symbols located zero bytes from the base address of the module.
The built-in filter "allow duplicate addresses" constrains or shows symbols that share a location with another symbol. When the filter is disabled, only one of each set of duplicate symbols is shown, with precedence given to the symbol with a unit.
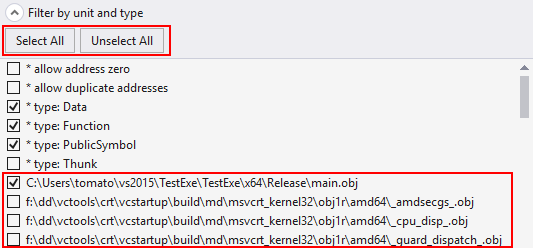
Built-in filters are also available to constrain or show symbols by type: data, function, PublicSymbol, Thunk.
You can also constrain the set of symbols available for browsing by unit in which they are located, where unit is an object file or DLL. (A unit of "none" implies the PDB does not identify the source of the symbol.) The select-all and unselect-all buttons above the built-in filters affect only the units. Select-all to browse within all units. Unselect-all and then select one or more modules to limit the browsing.

After narrowing a scope by unit and type, constrain the scope further by specifying one or more substrings in the Filter field at the bottom of PDB Explorer. Only symbols whose names contain the substring(s) are shown. A space between substrings implies 'and'; a comma implies 'or'.

List of Symbols
Symbols that match the selected filters are listed below the checkbox filters. The list can be sorted by any column, in ascending or descending order.

Columns are:
Address
Virtual address of the symbol, assuming base address is correct.
Name
A readable version of the symbol name. Hover over a PublicSymbol to see the exported symbol's mangled, or undecorated, name.

Hover over a symbol of type Data to see its kind. Kinds are elements of the DataKind enum.
Select simplify-name at the bottom right of PDB Explorer to see only names of functions in the list of symbols.

Unselect to see names, return values, and parameters.

Length
Size in bytes of the symbol. The length of a function is the size of all of its instructions.
Type
Data, Function, PublicSymbol, or Thunk.
Unit
Location of symbol.
Debugger Control
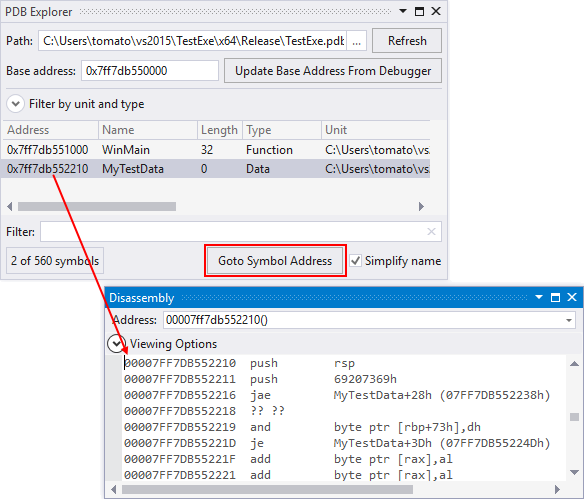
If PDB Explorer is running in an instance of Visual Studio attached to a process in debug mode, press "Goto Symbol Address" or Double-Click a symbol of type Function, PublicSymbol, or Thunk to make the debugger open the disassembly tool window at the location in virtual memory of the symbol; set breakpoints or modify code as allowed by the debugger. Double-click a symbol of type data to open the tool window at the location of symbol storage; examine or modify the value as allowed by the debugger.

Visual Studio 2008 and older
PDB Explorer is not available.


 Documentation Home
 Recently Changed